Some scientific results of Operation Snail
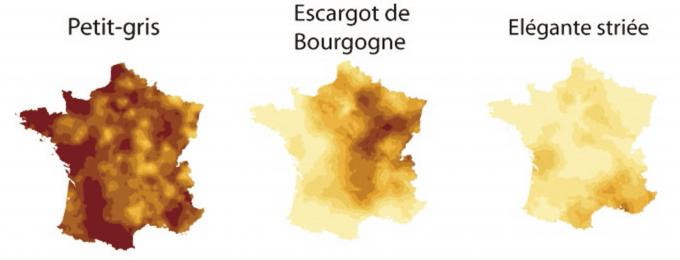
The first results show that Operation Snail is working well! Without being malacologists (mollusc specialists), the observers are able to distinguish the different species proposed in the system. Thus the results collected since 2009 confirm what we know about the distribution of species in France: the Petit-Gris is present and abundant everywhere. The Burgundy snail is absent from the Atlantic coast, while the elegant striated snail is absent from non-calcareous regions. The distribution of these various species is illustrated on the maps below.
Does the size of the garden affect the number of species?
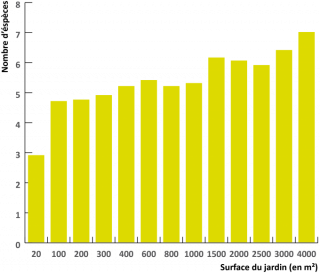
This graph shows the relationship between the number of snail and slug species in a garden and its area. It is immediately apparent that the number of species present in a garden increases with the area. For example, one finds on average a little less than 3 species of snails and slugs in a garden of 20 m² whereas one finds nearly 7 species on average in gardens of 4000 m² (a little less than the size of a soccer field).
However, one should not imagine that for an even larger garden, 10 000 m² for example, one would have twice as many species! In ecology, it has been noticed that from a certain surface, the number of species present in the habitat increases much less!
To evaluate this surface area, scientists need more data from very large gardens, such as schoolyards !
Does the environment surrounding the garden affect the number of snails and slugs ?
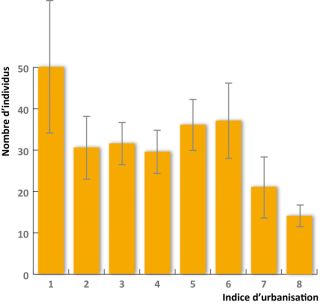
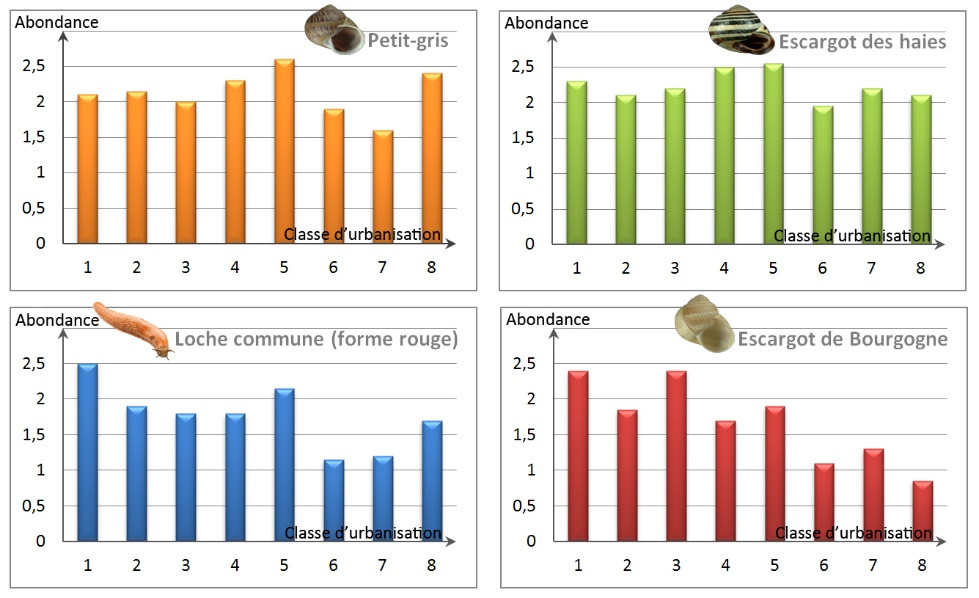
This graph represents the number of snails and slugs counted according to the urbanization index of the area surrounding the garden.
On this graph, a low urbanization index corresponds to a very little urbanized environment, a garden surrounded by fields and meadows for example, a high index corresponds to a very urbanized environment, a garden in downtown for example.
It can be seen that the higher the urbanization index, the lower the number of snails and slugs harvested.
But what do the gray bars on the graph mean?
These bars represent the standard deviation, which allows us to measure the differences in values around the mean, which is represented by the top of the orange rectangle. For example, for an urbanization index of 8, an average of 15 snails or slugs were found. The standard deviation bars tell us that for most gardens, the population was between 13 and 17 individuals.
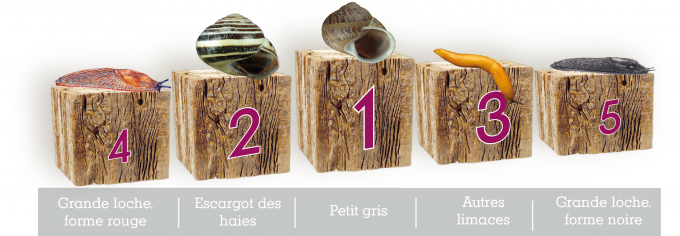
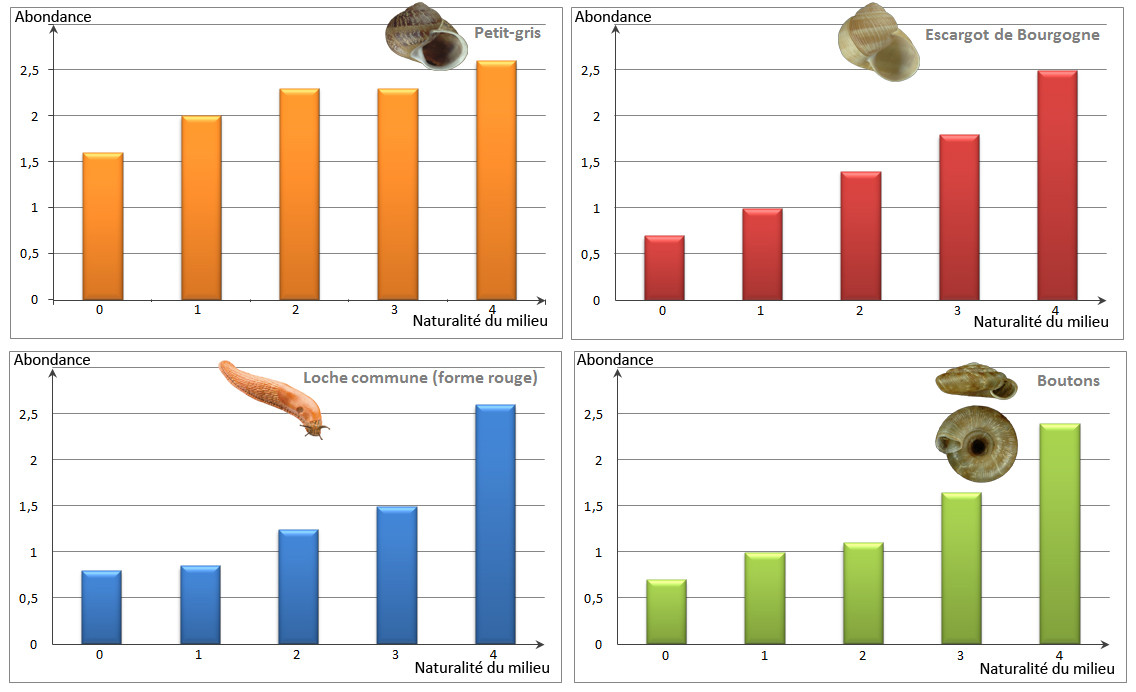
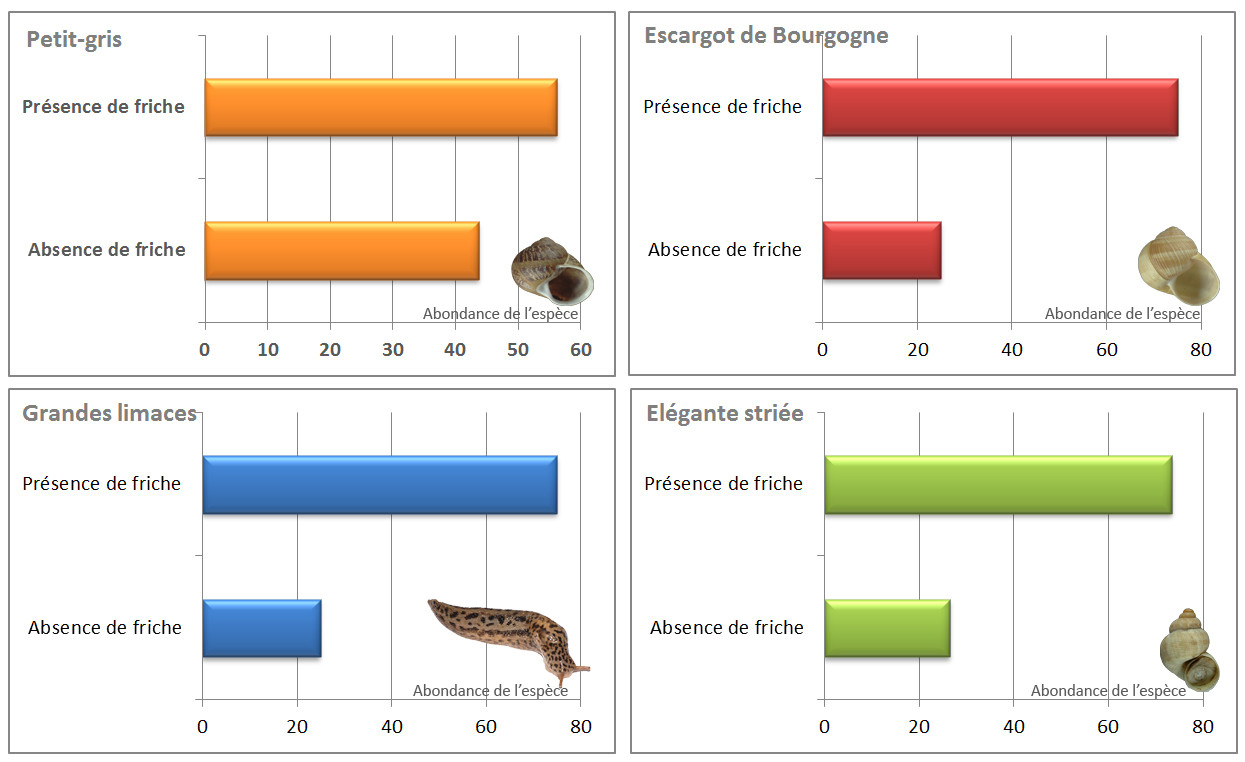
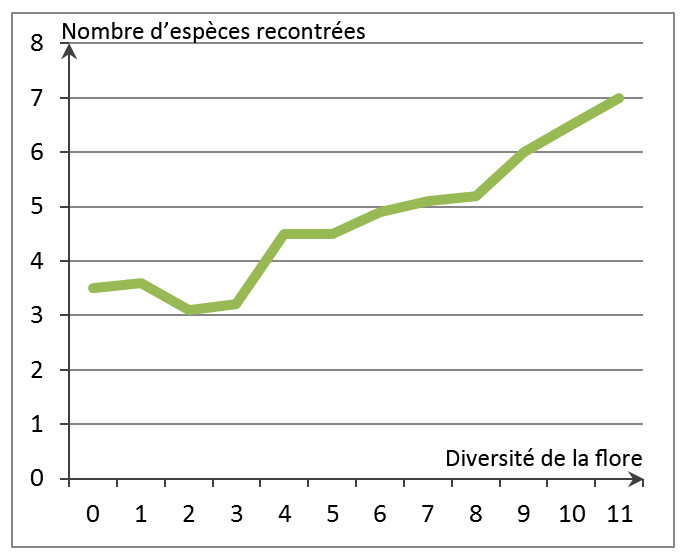
Finally, as these graphs show, most snail and slug species are sensitive to the way gardeners design and maintain gardens. The more they adopt a "natural" management method (maintaining overgrown areas, keeping ivy on trees, keeping nettles,...), the more snail and slug species are numerous. Some species such as the Burgundy snail are very sensitive to this naturalness of the garden, whereas the small grey snail manages to adapt even to the least natural gardens, which explains its first place in the Top 5 of the most frequently encountered snails.
Position your data
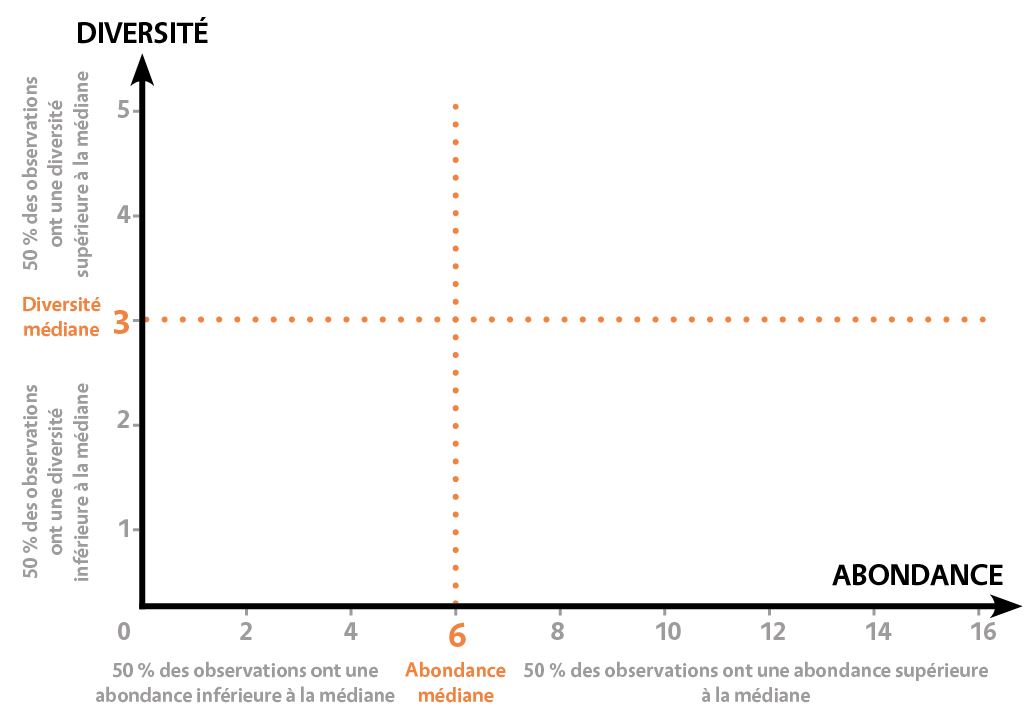
To situate your observations made with the "plate" protocol in relation to national observations, use this graph of specific diversity versus abundance. This will allow you to estimate the health of the snail populations in your establishment.
Using this graph :
To place your point on the graph, you need to calculate :
• Calculating average abundance: if you saw 7 snails under the first board, 5 under the second and 9 under the third, the average abundance is (7+5+9)/3= 7.
To position yourself on the graph, you must then take into account the surface area of your board. The results of the graph correspond to an area of 0.16 m² (40 x 40 cm board). To place your point, use the rule of 3: multiply the average abundance by 0.16 and divide by the length of one side of the board (in m) multiplied by the other side of the board (in m). In our example, if the board measures 40 cm by 50 cm, we get: 7*0.16 / (0.4 x 0.5) = 5.6. Please note that the formula is given in metres! (50 cm <=> 0.5 m).
• The average diversity of species (or groups of species) observed per bed: if you saw 4 Small grey snails and 3 shiners under the first bed (i.e. 2 different species), and 2 Small grey snails, 2 shiners, 6 velvet snails and 1 Common locust under the second bed (i.e. 4 different species); the average diversity of snails in your yard is (2+4)/2 = 3. This measure is not related to the size of the bed.
Understanding your result :
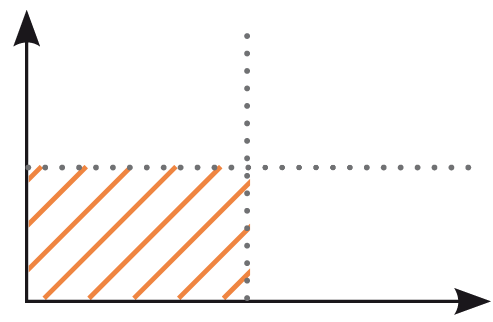
In principle, there is a good diversity of species and therefore of environments, but an external factor, such as the weather, has probably disrupted the surveys. Generally speaking, this is a sign of good biodiversity. Surveys must be continued to confirm this. This may be due to recent changes in the landscape or in local practices. This apparent but low diversity may then be a transitional stage towards a poorer species composition.
In contrast to case 2, and unless the surveys have been affected by external factors (e.g. the type of soil rock influences the snail population: on a chalky soil there are often more snails than on an acidic soil), there is every indication that the health of biodiversity is not at its best, compared to the national sample. In this case, it is necessary to continue the surveys to try to determine the factors involved.
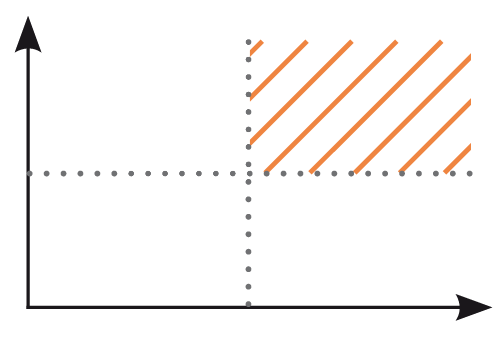
This observation is the expression of a healthy and functional biodiversity. Continuing the surveys will then allow us to identify the factors behind this good state. Do they depend on practices or on a larger scale effect and on adjacent landscapes?
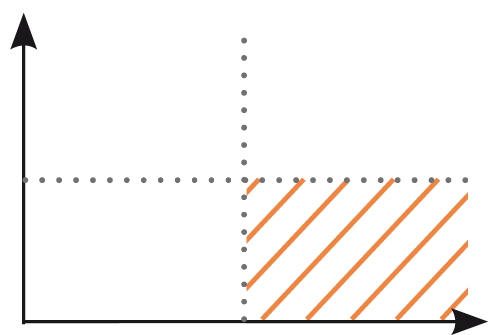
High abundance but low diversity may reflect an imbalance in the community with one or a few species in the majority. This situation can also occur when conditions become favourable very locally in a context that is usually unfavourable. Populations of species maintained in this type of situation may increase, but other species have difficulty in doing so. Further surveys are also needed here.
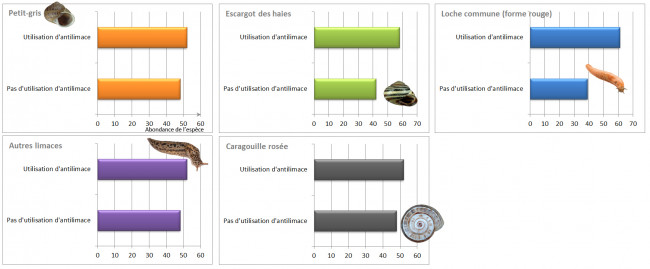
A surprising result!
In gardens where slug pellets are used, observers have found more slugs than in untreated gardens. How can this paradox be explained? Slug pellets are applied to gardens with a lot of slugs: slugs are not the consequence of the presence of slug pellets, but the cause! Another phenomenon to consider is that people who use slug pellets keep a closer eye on the presence of slugs and will therefore notice more slugs.
