Water mark algae
With the tides, a mass of natural (algae, driftwood, marine egg-laying, etc.) and anthropogenic (fish fillets, glass, plastic, etc.) debris settles and accumulates on the foreshore, constituting what we call the high water (or tide) mark. The numerous algae making up this water mark come from communities that develop underwater and which, once stranded, are far from being simple and useless "waste". Indeed, they contribute to the natural balance of shores. Nowadays, this high water mark is subject to profound changes of anthropic and climatic origin, which modify its composition, functioning and natural dynamics, and thus affect the conservation of emblematic species linked to it. By taking part in the ALAMER protocol, you will discover an unsuspected biodiversity by trying to identify some forty species or groups of species of algae disseminated all along the seashore, to help better understand these changes in time and space.
Have a look on the presentation video:
The protocol:
-
Identify an observation area. Position a transect [=study area marked by a straight line] (materialized by a measuring tape or a piece of string) of 25 meters long on the fresh water mark and note its location using a fixed marker nearby or its GPS coordinates, which will then be used to position the transect on a map.
-
To the scale of the transect. Characterize the average size of the freshwater beach on the transect [=study area marked by a straight line] (total length, average width and average thickness), note any evidence of beach management practices that you observe (presence of sieve marks, a slipway for motorized access or other activities), and photograph the transect if you wish. One transect is needed for every ten to fifteen pupils, so it is possible to carry out several transects in the same trip.
-
To the scale of quadrats. Form groups of pupils (pairs or triples) and divide them into 4 or 5 places on the transect. Each group of students positions its quadrat, a study area marked by a square, of one square meter on the seashore, identifies it by a number placed in the quadrat and takes a photo. Then each group:
- Sorts the algae in its quadrat by species (if possible) or groups of species;
- Identify each species or group of species using the algal identification key;
- Quantifies each species or group of species in relation to all the others in the quadrat, using an abundance index (from 1 "rare algae" to 4 "majority algae").
Let’s begin by having a look on these documents:
- The participant's kit for algae to be found all along the Atlantic coastline (except for the Basque Country) including details of the protocol, the field sheet and the identification key;
- The participant's kit for the Basque Country only including details of the protocol, the field sheet and the identification key;
- Quadrats identification numbers.
When to participate?
This protocol can be carried out all year round on the North Sea, Channel and Atlantic coastline, including sandy and shingle beaches. We advice you to do so between three hours before and three hours after low tide for safety reasons. Depending on the biogeographical zone you are in, the list of species or groups of species in the algal identification key will not be the same (Be careful: we previously provide a specific protocol for both Atlantic coastline and the Basque Country).
What should I do before?
How to prepare your pupils:
Before taking off on the assault of the tide mark algae, we recommend you to hold a special in-class session to:
- Identify the various species and groups of species. Encourage them to rely on the identification key, paying close attention to the biogeographical zone you are in;
- Estimate the abundance index for each species or group of species;
- Gather and pack the field material.
To do so, do not hesitate to test your pupils on algae you collected on beach prior to the class session.
Materials you’ll need (for 10 to 15 pupils):
- 1 transect [=study area marked by a straight line] L=25 meters;
- 5 quadrats [=study area marked by a square] S=1 square meter;
- 5 algae identification keys ;
- 5 field sheets for pupils;
- 1 field sheet for the teacher;
- Our quadrats identification numbers;
- 1 camera (with macro mode);
- Something to write with.
Useful tips!
To materialize your transect [=study area marked by a straight line], use either:
- A graduate tape of at least 25m in length;
- Or a 25m long sea rope.
To materialize your quadrats [=study area marked by a square], use either:
- A 4m long piece of seaweed with 1 knot every meter to represent the vertices of the square;
- Or 4 PVC tubes of one meter in length connected by a string.
A few precisions
Why use a transect and quadrats?
By proposing that all participants carry out observations in the same study areas (here, a 25-meter transect and 1-square meter quadrats), it will be possible to make comparisons of these observations (for example, the average volume of algae along a transect or the average number of species identified in the quadrats), regardless of who carried them out.
Why sample 5 quadrats per transect?
In the test phases of the protocol, 10 quadrats per beach were sampled. It turned out that from the 5th quadrat onwards, almost 90% of the total number of species were observed there. In order to find the right compromise between participation time and the percentage of observable species, the sampling of 5 quadrats appeared to represent the best ratio. Of course, in order to avoid this number being a barrier if you have small numbers in your class, you can choose to carry out less than 5 quadrats per transect (5 quadrats being the ideal, but this is not an absolute rule). They will be treated with equal importance!
Why use the algal identification key?
It is estimated that there are about 1500 macroalgae [= algae visible to the naked eye] present in European seas. In order to simplify the protocol, it was not possible to propose all these species for identification, especially as some require microscopic observation to be identified. We therefore selected 40 species or groups of species of interest to study in the context of global changes (climatic and anthropogenic). Some of these species are common along the entire North Sea, Channel and Atlantic coasts, others have limited but well-defined geographical areas of distribution, while others have arrived more recently on our coasts and will potentially spread further along the coast.
Few information on algal determination
The algal identification key is constructed in such a way that there is always a species group where one can classify one's alga. For example, if a piece of red algae is difficult to identify down to the species level, it is possible to remain in the species group "Curly red algae" or "Flattened red algae" or "Filamentous red algae", without necessarily going further in the classification. This approach is important for scientific monitoring because it ensures that the species or group of species is not "forgotten" at the time of the survey.
Sending your observations
It will take only a few minutes! Log in and enter your data on vigienature-ecole.fr. Please, let us know if you did not see any individuals: this is important information for our researchers! Do not forget to provide some context if required.
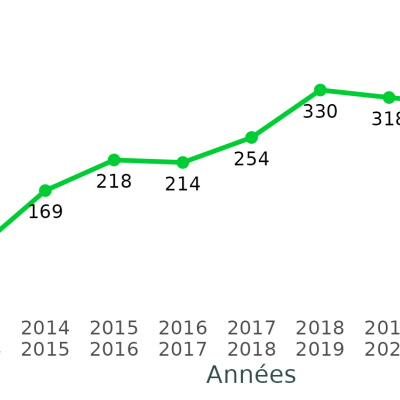
You may find that questions and hypotheses concerning the distribution of living beings arise from your observations (are there as many birds in the city as there are in the countryside? Does the use of pesticides have consequences on snails, etc.). The data positioning tools included in the participation report, which is sent at the end of the school year to all who are registered on the website, provides answers to some of these questions. The graphics included in the report position the observations made in a given establishment in relation to the data collected as a whole. For example, you will learn whether observing 4 species of snails in an establishment is a sign of healthy or poor biodiversity. Explanations are provided to help you interpret the results. These documents encourage your pupils to consider which actions could be taken to promote biodiversity in the courtyard or playground (installation of feeders, setting aside plots of land, etc.).By repeating the observations, you will be able to monitor the impact of these actions over time.
You can also process the data you’ve collected in other ways. For example, you can create graphics representing the species present in different areas of the establishment. These graphics allow pupils to visualize in a simple manner that there is a significant difference between two areas of the schoolyard. They can then propose hypotheses to explain the population differences (abiotic factors such as humidity, temperature for example).
You can also produce graphs showing the evolution of the number of species present seasonally. They allow you to follow changes in the number of individuals over the course of the year (for example, for the notion of bird migration). It is also possible to produce such graphs over several years by accumulating the numbers recorded month by month.
Many other illustrations are possible. For example, pupils can be asked to situate their data on an aerial photo of the school. They can then offer explanations for possible differences in the occupation of the various areas of the school.
Finally, you will find a wide range of educational activities on our website. Some of them are suggestions for introducing this activity but others take it a step further. For example, we have developed ways for your pupils to learn how to analyze data in the manner of an ecological researcher, or for them to think about actions to be taken within their establishments to promote biodiversity.
Protocole plagesvivantes : ALAMER
Pedagogical tipsHere are some suggestions for activities that can help you integrate this observatory to your educational progress.
-
Icone
 TitreAnalysing dataDescriptionCycle 4 and High SchoolTexte
With Vigie-Nature School, you collect data on biodiversity in your school. This data will be useful to researchers, but you can also use it in class. We suggest several ways to do this.
-
Icone
 TitreCreate a determination keyDescriptionFrom CP to TerminaleTexte
This tutorial will show you how to create a simple determination key with the OpenKeys software. You can, for example, create keys referencing only the species present in your region.
-
Icone
 TitreHypothesisDescriptionCycles 3 and 4 - High schoolTexte
In this game the pupils have to design a data collection protocol. The protocol chosen for the duration of the game will influence the amount of data collected, its quality and therefore the scientific results!