BioCoast Junior
For the past twenty years, without scientists really understanding why, the quantity of brown algae seems to be declining at various points along the coastline. This results not only in a change in the algal cover on the rocks, but also in a change of the species present. Where this occurs, the brown algae we study are replaced by oysters, mussels and limpets. Several hypotheses can account for this disappearance: climate change, a growing number of seaside visitors, pollution, invasive species that prevent the development of brown algae, and the proliferation of certain herbivores, such as limpets, which love to feed on brown algae.
With the help of your observations, the scientists at Planète Mer and the Muséum national d’Histoire naturelle are hoping to better understand these changes!
Have a look on the presentation video:
The protocol:
- Photograph the upper foreshore. Begin by asking your pupils to photograph the upper foreshore, looking toward the sea. Then head down toward the water and have them observe the various algal belts and their succession.
- Be careful: in some cases, the belts may overlap. The different species of algae can be distinguished by their various shapes and colours.This protocol involves six species of brown algae. On your way down to the sea, ask your pupils to complete the field sheet, indicating the algae they observe. When you arrive at the lower part of the foreshore, take a second photograph looking inland.
- Record the species in a quadrat. Then assign your pupils to a seaweed belt(s) of your choice. Remember that the goal of this study is to collect as much information as possible per belt. The statistical processing of the data only becomes significant starting at thirty observations. It is therefore preferable to observe the same belt at any given site so as to quickly obtain this quota of thirty observations per belt. Once the belt has been selected, each group of pupils tosses their quadrat onto the algae and begins to count all the living gastropods they find in it. The pupils will then need to photograph a specimen of each species: remember to check the quality of the photos before removing the quadrat!
Let’s begin by having a look on these documents:
- The participant's kit which provides all the tools you will need to be part of this journey, such as the (printable!) identification key,
- The observatory's poster,
- Labels with species names (to be used when taking photos).
When to participate?
You can take part in this protocol and send us your data throughout the year. Of course, participation will be more enjoyable on sunny days from April onward!
Getting ready
Prepare your outing. Locate a rocky foreshore where algal belts are diverse and easily accessible at low tide. Not all the belts indicated on the observation sheets will necessarily be represented in the field: this is not a problem. Conduct your outings at low tide (tide schedules available online). For safety reasons, begin your observations one hour before low tide and end
them one hour after low tide at the latest. Finally, remember to print labels for your photos (see the last page of the booklet).
Prepare your students. In order for scientists to be able to analyse your data, your photos must be usable. We advise you to practice using a camera with a macro setting with your pupils. Without this, the information collected won’t allow for scientific interpretation. In addition, don’t hesitate to collect empty shells ahead of time. This will help you to familiarise your pupils with identification in the classroom and make the field session all the easier! You can also use the photo quizzes available on our website.
Materials you’ll need (per group of 3-4 pupils):
- 1 camera (with macro mode);
- 1 33 cm quadrat;
- the field sheet;
- the species identification sheet (to be laminated if possible before leaving);
- labels with species names (to be used when taking photos);
- something to write with.
A few precisions
Concerning the box "rock not covered with brown algae
As the quadrats are launched randomly, it is possible that they fall on an area where brown algae are not dominant but rather on bare rock or other algae (red for example). This is called 'boundary' conditions, meaning that the species of gastropods you identify will be on the edge of the belt. These observations provide essential additional information and complement the study of habitat/species relationships.
It is also possible that the quadrat falls on a nearly bare rock but in a clearly identified belt. Do not move the quadrat! In these two cases, identify and add the gastropods you find in the "other observations" column.
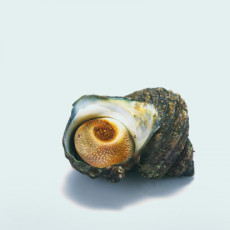
Unidentified shell?
If certain species cannot be clearly identified, it is important to send their photos so that the scientists can identify them.
Do not prospect in pooled water.
Tide pools are ecosystems with highly specific environmental conditions of their own (species constantly wet, strong variation in water temperature). Therefore, they are not covered in this programme.
What is a foreshore?
The foreshore is the part of the coastline that is submerged at high tide and exposed at low tide. This part of the shore occupies the mid-littoral zone, regularly exposed and submerged by the tides. It is intermediate between the marine and terrestrial environment and subject to considerable stress due to the constant changes in the physical parameters that define it: salinity, duration of exposure, temperature, etc. The foreshore can be of several types: sand, gravel or rocky. It is this last type of foreshore that we propose to study.
What is a quadrat?
A quadrat is a square (or other four-sided shape) with a predefined surface area. It can be made of metal, wood or plastic. It is used in ecology to take inventories. In our case it is a square with 33 cm sides. It can be made with four PVC tubes connected by a string.
In this programme, we are only interested in six species of brown algae and 19 species of gastropods. The identification key we provide in our participant’s kit will help you recognize these species/draw a distinction between them.
Sending your observations
It will take only a few minutes! Log in and enter your data on vigienature-ecole.fr. Please, let us know if you did not see any individuals: this is important information for our researchers! Do not forget to provide some context, such as the type of environment (urban, rural?) or the use of phytosanitary products. All these data are likely to explain the algae’s distribution over time and space (observation area). This step, yet mandatory, will be asked only once for each area. Please find here all the information you will need to collect prior to the class session.
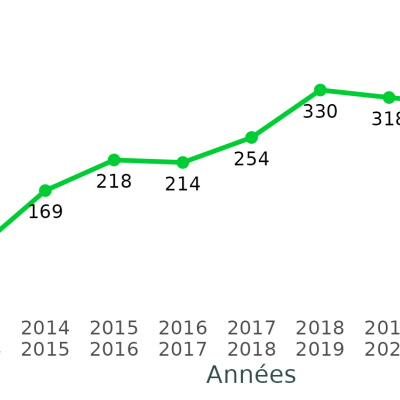
You may find that questions and hypotheses concerning the distribution of living beings arise from your observations (are there as many birds in the city as there are in the countryside? Does the use of pesticides have consequences on snails, etc.). The data positioning tools included in the participation report, which is sent at the end of the school year to all who are registered on the website, provides answers to some of these questions. The graphics included in the report position the observations made in a given establishment in relation to the data collected as a whole. For example, you will learn whether observing 4 species of snails in an establishment is a sign of healthy or poor biodiversity. Explanations are provided to help you interpret the results. These documents encourage your pupils to consider which actions could be taken to promote biodiversity in the courtyard or playground (installation of feeders, setting aside plots of land, etc.). By repeating the observations, you will be able to monitor the impact of these actions over time.
You can also process the data you’ve collected in other ways. For example, you can create graphics representing the species present in different areas of the establishment. These graphics allow pupils to visualize in a simple manner that there is a significant difference between two areas of the schoolyard. They can then propose hypotheses to explain the population differences (abiotic factors such as humidity, temperature for example).
You can also produce graphs showing the evolution of the number of species present seasonally. They allow you to follow changes in the number of individuals over the course of the year (for example, for the notion of bird migration). It is also possible to produce such graphs over several years by accumulating the numbers recorded month by month.
Many other illustrations are possible. For example, pupils can be asked to situate their data on an aerial photo of the school. They can then offer explanations for possible differences in the occupation of the various areas of the school.
Finally, you will find a wide range of educational activities on our website. Some of them are suggestions for introducing this activity but others take it a step further. For example, we have developed ways for your pupils to learn how to analyze data in the manner of an ecological researcher, or for them to think about actions to be taken within their establishments to promote biodiversity.
Protocole biolit : Biolit junior
Pedagogical tipsHere are some suggestions for activities that can help you integrate this observatory to your educational progress.
-
Icone
 TitreHypothesisDescriptionCycles 3 and 4 - High schoolTexte
In this game the pupils have to design a data collection protocol. The protocol chosen for the duration of the game will influence the amount of data collected, its quality and therefore the scientific results!
-
Icone
 TitreAnalysing dataDescriptionCycle 4 and High SchoolTexte
With Vigie-Nature School, you collect data on biodiversity in your school. This data will be useful to researchers, but you can also use it in class. We suggest several ways to do this.
-
Icone
 TitreCreate a determination keyDescriptionFrom CP to TerminaleTexte
This tutorial will show you how to create a simple determination key with the OpenKeys software. You can, for example, create keys referencing only the species present in your region.