Lichens-GO
Lichens are extraordinary organisms. They are made up of a fungus and an alga living together in symbiosis. The fungus allows the lichen to adhere firmly to a substrate (rock, tree trunk or even the ground). It protects the alga against external aggressions (UV radiation, drying out, predators, etc.) and captures water and minerals from the atmosphere, fog, rain and snow. The alga provides the fungus with sugars and nutrients from photosynthesis.
As they are permeable to water, lichens are very much exposed to atmospheric pollution. However, not all lichen species are equally affected by pollution. Some are particularly sensitive to it and die quickly when the air becomes polluted, others on the contrary are very resistant, while still others actually benefit from certain types of pollution.
By using this protocol to study the different species of lichens that grow on trees, we can assess air quality. And as lichens grow very slowly, they provide us with a cumulative pollution level over a period of several years rather than an instantaneous value.
Have a look on the presentation video:
The protocol:
-
Selecting a zone. The area you will be studying should have at least three isolated trees (i.e. not growing in a forest or grove). These trees should be spaced 2 to 10 meters apart.
-
Selecting trees. You will have to make an inventory of the lichens present on 3 trees (if the chosen area prevents you from observing three trees, you can do it on only two, but no fewer). These trees must be:
- straight, with a circumference over 40 cm;
- neither coniferous trees (pines...), nor plane or birch trees (the bark of these species is regularly renewed or too acidic, which prevents old lichens from forming);
- have little or no moss or ivy cover;
- with the lowest branches at least 2 meters up.

-
Recording the lichens. Using a compass (or your smartphone), determine the north facing side of each tree (compass should point north). Attach the grid consisting of 5 squares (see materials section next page) vertically to the trunk using strings or straps. The bottom of the grid must be placed one meter off the ground.
Using the identification key, identify the different species present. For each species, indicate the square or squares on the grid where it is present. Ideally, take a photo (macro setting) of each species. -
Do the same for the east, west and south sides of the tree. Remember to complete the field sheet as you go.
Let’s begin by having a look on these documents:
-
The participant's kit which provides all the tools you will need to be part of this journey, such as the (printable!) identification key,
When to participate?
This protocol can be carried out all year round on a dry day (rain complicates lichen identification).
Divide up the work
In order not to waste time in the field, we recommend that you review the various stages of the protocol with your pupils in the classroom. Don’t hesitate to form sub-groups for each tree before the field trip.
Do a location check in the field
We advise you to double check, beforehand, that the trees on which you want to carry out this study meet the criteria defined above. You can also use online mapping tools to do this.
Materials you’ll need
- a grid with five 10 x 10 cm squares, which will allow you to delimit your observation area. You can either use 10 x 10 cm mesh or print the "grid" document on page 119;
- string to secure the grids;
- a magnifying glass (magnification x 10);
- a compass or your phone to determine the tree’s exposure;
- some water;
- a camera (optional);
- the identification key and the field sheet!
A few precisions
Why install a grid with 5 spaces?
In this protocol, as is often the case in ecology, we assess two parameters: the number of species present and the abundance of these species. Finding a lichen in a single box will indicate that it is less abundant than if it were present in all the boxes. In our analyses to assess air quality, we will consider both of these parameters (species diversity and abundance of each).
Why do an inventory of all four sides of a tree?
During preliminary studies, we have noticed that the face of the tree with the highest lichen abundance varies according to many factors: geographical area, humidity and sunlight on the different sides, proximity of buildings, etc. To get around this difficulty, we have chosen to ask you to study all four sides of each tree.
Why three trees?
Carrying out observations on three trees gives a better overview of a site. It also allows us to average the results if one of the trees is richer or poorer in lichens than the others.
How can air quality be assessed from lichens?
There is currently a methodology, called Fomofa, which makes it possible to assess air quality based on the types of lichens present (crustose, foliose and/or fruticose). This method tells us that:
• if only crustose lichens are present, there is probably a relatively high level of air pollution;
• if there are both crustose and foliose lichens present, air pollution is moderate;
• finally the presence of fruticose lichens indicates very low air pollution.
Within the framework of this protocol, we will try to be even more precise (this is why we are asking you to name the lichens observed)... but for this, we need a lot of data!
Few information about species' determination
In France, there are hundreds of different species of lichens: their determination is thus not always that simple! We advise you to do your observations by dry weather and to bring a magnifying glass.
The identification key we provide in our participant’s kit, designed in collaboration with Participae, will help you recognize the lichens that are the most common both in French (mainland) cities and villages.
Sending your observations
It will take only a few minutes! Log in and enter your data on vigienature-ecole.fr. Please, let us know if you did not see any individuals: this is important information for our researchers! Do not forget to provide some context, such as the type of environment (urban, rural?) or the exposure/insolation of the trees (i.e are they in shade or not?). All these data are likely to explain the lichens’ distribution over time and space (observation area). This step, yet mandatory, will be asked only once for each area. Please find here all the information you will need to collect prior to the class session:
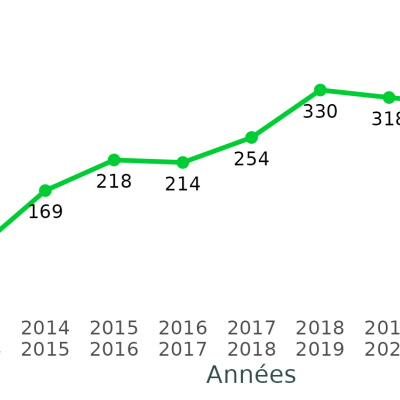
You may find that questions and hypotheses concerning the distribution of living beings arise from your observations (are there as many birds in the city as there are in the countryside? Does the use of pesticides have consequences on snails, etc.). The data positioning tools included in the participation report, which is sent at the end of the school year to all who are registered on the website, provides answers to some of these questions. The graphics included in the report position the observations made in a given establishment in relation to the data collected as a whole. For example, you will learn whether observing 4 species of snails in an establishment is a sign of healthy or poor biodiversity. Explanations are provided to help you interpret the results. These documents encourage your pupils to consider which actions could be taken to promote biodiversity in the courtyard or playground (installation of feeders, setting aside plots of land, etc.).By repeating the observations, you will be able to monitor the impact of these actions over time.
You can also process the data you’ve collected in other ways. For example, you can create graphics representing the species present in different areas of the establishment. These graphics allow pupils to visualize in a simple manner that there is a significant difference between two areas of the schoolyard. They can then propose hypotheses to explain the population differences (abiotic factors such as humidity, temperature for example).
You can also produce graphs showing the evolution of the number of species present seasonally. They allow you to follow changes in the number of individuals over the course of the year (for example, for the notion of bird migration). It is also possible to produce such graphs over several years by accumulating the numbers recorded month by month.
Many other illustrations are possible. For example, pupils can be asked to situate their data on an aerial photo of the school. They can then offer explanations for possible differences in the occupation of the various areas of the school.
Finally, you will find a wide range of educational activities on our website. Some of them are suggestions for introducing this activity but others take it a step further. For example, we have developed ways for your pupils to learn how to analyze data in the manner of an ecological researcher, or for them to think about actions to be taken within their establishments to promote biodiversity.
Protocole lichen : Lichen Go
Pedagogical tipsHere are some suggestions for activities that can help you integrate this observatory to your educational progress.
-
Icone
 TitreCreating a weather station in ArduinoDescriptionCycle 4 - High SchoolTexte
In this activity, we suggest that you and your technology colleague enable your pupils to make sensors that allow them to measure the environment (temperature, humidity, etc.).
-
Icone
 TitrePromoting biodiversity in your institutionDescriptionCycles 2, 3 and 4 - High SchoolTexte
Thanks to different action proposals, we will see how to promote biodiversity within your school. The Vigie-Nature School protocols will allow us to monitor the impact of these actions on biodiversity.
-
Icone
 TitreHypothesisDescriptionCycles 3 and 4 - High SchoolTexte
In this game the pupils have to design a data collection protocol. The protocol chosen for the duration of the game will influence the amount of data collected, its quality and therefore the scientific results!
-
Icone
 TitreAnalysing dataDescriptionCycle 4 and High SchoolTexte
With Vigie-Nature School, you collect data on biodiversity in your school. This data will be useful to researchers, but you can also use it in class. We suggest several ways to do this.
-
Icone
 TitreCreate a determination keyDescriptionFrom CP to TerminaleTexte
This tutorial will show you how to create a simple determination key with the OpenKeys software. You can, for example, create keys referencing only the species present in your region.