Worm Plots
Earthworms represent the world’s top terrestrial animal biomass: it is estimated that there is, on average, one ton of earthworms per hectare.
Earthworms play a key role: they dig open tunnels near the soil’s surface, thus favoring infiltration of water. These tunnels allow plant roots to grow and provide easier access to the water and oxygen contained in the soil. To feed, earthworms break down and bury dead plants. By swallowing and digesting them, they contribute to their decomposition. Their excrements are thus rich in nutrients that plants use to grow.
But if the soil is frequently trampled or ploughed, the number of worms can drop by 50 to 80%! Such a loss can have very negative consequences on plant crops and the health of the soil in general. Researchers from the University of Rennes 1 are keen to assess the state of health of earthworm populations in cities: through this observatory, you can help them. Get your mustard pots ready!
Have a look on the presentation video:
Le principe du protocole :
- Stake out three 1 m2 sampling zones in a row. Choose a uniform, representative area for the plot (avoid trampled areas). The three 1 m2 zones should be placed in the center of this space, if possible at a distance of 6 m from each other. Take a photo of the immediate environment, then a second photo of the soil surface. Then mow the vegetation just before taking your sample (mow an additional 10 cm around each zone for better visibility). Take another photo of the soil surface.
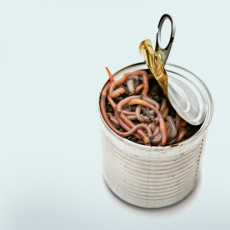
- Prepare the solution using gloves. For each watering, and using a shaker, dilute with a little water 300g of Amora “fine et forte» (fine and strong) mustard (brand is mandatory to avoid any bias in the protocol). Pour into a watering can, rinse the shaker and add 10 L of water.
- Water each sampling zone evenly with the mixture. For the next 15 minutes, collect any worms that come to the surface (only within the delimited area). Keep the worms in the basin with a little water. So as not to hurt the worm, be sure to wait until it is out of its gallery before picking it up. Avoid trampling around the areas.
- When your 15 minutes are up, pour on another 10 liters of the solution. Collect any worms for another 15 minutes. If individuals are still surfacing after the first 15-minute period, wait a bit for the second watering and collect those worms first.
- Spread the worms on a light-coloured surface, such as a tarp. Identify them with the help of the identification key and separate them into the 4 groups. Count the number of individuals per group and record the results on the field sheet. Take a photo of a specimen for each species.
- Rinse the worms with plain water. Let them go about 2 meters from the zone where you poured the mustard solution.
Let’s begin by having a look on these documents:
- The participant's kit which provides all the tools you will need to be part of this journey, such as the (printable!) identification key,
- The observatory's poster.
When to participate?
You can participate from January through April, preferably in the morning when temperatures are between 6° and 10°C and the soil is humid, but not soggy.
What should I do before?
Spread the work, divide the tasks.
In order not to waste time in the field, we recommend you thoroughly brief your pupils of the various stages of the protocol in the classroom. Don’t hesitate to split up the work into groups: pupils in charge of the water-mustard mixture, others who collect the worms and a final sub-group who can identify and photograph them.
Don’t forget the water.
For each zone, you will need 2 x 10 L of water. This makes a total of 60 L of water for the 3 zones. You may not have a water point near the observation area, so we suggest gathering large 5 L water bottles, the kind sold in supermarkets (4 bottles per group).
Getting your pupils ready!
You can also use the photo quizzes available on our website.
Materials you’ll need (by group of 3-4 pupils):
For three 1 m2 zones:
- Grass trimmer (if there is grass),
- 12 pegs + string + meter stick (to delimit the 3 zones),
- 3 x 10 L watering cans + rose attachment,
- Agitators (kitchen whisk for example),
- Water: 60 L (2 x 10 L per m2) + more for rinsing,
- 1.8 Kg (3x2x300 g) of Amora fine, strong mustard,
- Flat tweezers and gloves,
- Pale tarp for identification,
- Field sheets,
- Basin,
- Camera.
A few precisions
Why carry out the earthworm protocol between January and April?
We ask that earthworms be collected at the end of winter, when the soil has warmed up and morning temperatures are around 6-10°C. Indeed, when the soil is too cold (<8°C at a depth of 10 cm) or too dry, some species die (as with epigeic species) while others enter a phase of slowed activity, called lethargy. At this point the earthworms no longer react to the application of mustard. For some of them (anecic black-headed worms), this phenomenon is triggered hormonally during the month of June.
Why does mustard make the worms come out?
Mustard contains an active ingredient, Allyl Isothiocyanate (AITC), which is stinging to earthworms. Contact with AITC, triggers an escape reflex in earthworms, which drives them to the surface.
Why use "Amora Fine et Forte" mustard?
The concentration of AITC varies from one brand of mustard to another, so to be able to compare the results, it is important that each participant use the same mustard, hence the use of Amora Fine et Forte, available everywhere in France.
Why mow the lawn?
Tall grass may hide some earthworms and therefore distort the results.
Few information about species’ determination
It is very difficult to identify earthworms down to the species level, which is why we propose grouping them into 4 categories that bring together species (with a slightly different appearance) with similar ecologies.. The participant’s kit provides an identification key that will help you and your pupils to recognize and name the different species.
Sending your observations
It will take only a few minutes! Log in and enter your data on vigienature-ecole.fr. Please, let us know if you did not see any individuals: this is important information for our researchers! Do not forget to provide some context, such as the type of environment (urban, rural?) or the trampling frequency and intensity. All these data are likely to explain the worms’ distribution over time and space (observation area). This step, yet mandatory, will be asked only once for each area. Please find here all the information you will need to collect prior to the class session.
You may find that questions and hypotheses concerning the distribution of living beings arise from your observations (are there as many birds in the city as there are in the countryside? Does the use of pesticides have consequences on snails, etc.). The data positioning tools included in the participation report, which is sent at the end of the school year to all who are registered on the website, provides answers to some of these questions. The graphics included in the report position the observations made in a given establishment in relation to the data collected as a whole. For example, you will learn whether observing 4 species of snails in an establishment is a sign of healthy or poor biodiversity. Explanations are provided to help you interpret the results. These documents encourage your pupils to consider which actions could be taken to promote biodiversity in the courtyard or playground (installation of feeders, setting aside plots of land, etc.).By repeating the observations, you will be able to monitor the impact of these actions over time.
You can also process the data you’ve collected in other ways. For example, you can create graphics representing the species present in different areas of the establishment. These graphics allow pupils to visualize in a simple manner that there is a significant difference between two areas of the schoolyard. They can then propose hypotheses to explain the population differences (abiotic factors such as humidity, temperature for example).
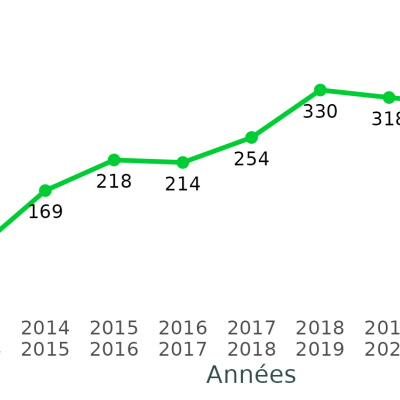
You can also produce graphs showing the evolution of the number of species present seasonally. They allow you to follow changes in the number of individuals over the course of the year (for example, for the notion of bird migration). It is also possible to produce such graphs over several years by accumulating the numbers recorded month by month.
Many other illustrations are possible. For example, pupils can be asked to situate their data on an aerial photo of the school. They can then offer explanations for possible differences in the occupation of the various areas of the school.
Finally, you will find a wide range of educational activities on our website. Some of them are suggestions for introducing this activity but others take it a step further. For example, we have developed ways for your pupils to learn how to analyze data in the manner of an ecological researcher, or for them to think about actions to be taken within their establishments to promote biodiversity.
Protocole vdt : Earthworms
Pedagogical tipsHere are some suggestions for activities that can help you integrate this observatory to your educational progress.
-
Icone
 TitreCreating a weather station in ArduinoDescriptionCycle 4 - High SchoolTexte
In this activity, we suggest that you and your technology colleague enable your pupils to make sensors that can be used to measure the environment (temperature, humidity, etc.).
-
Icone
 TitreHypothesisDescriptionCycles 3 and 4 - High schoolTexte
In this game the pupils have to design a data collection protocol. The protocol chosen for the duration of the game will influence the amount of data collected, its quality and thus the scientific results!
-
Icone
 TitreAgricultural practices and biodiversityDescriptionHigh SchoolTexte
In order to protect the environment, it is necessary to find agricultural practices that maintain a sustainable balance. This activity proposes to look at the link between earthworms and agriculture.
-
Icone
 TitreZig-Zag the earthwormDescriptionCycle 2Texte
This fun activity introduces the world of earthworms through the story of Zig-Zag the earthworm!
-
Icone
 TitreAssessing the health of earthworms in your facilityDescriptionCycles 3 and 4 - High schoolTexte
This activity proposes a project approach with workshop work that allows students to take responsibility and work independently. The objective is to make students understand the importance of earthworms for the soil and the means to preserve them.
-
Icone
 TitreThe earthworm, star of the soil!DescriptionCycles 3 and 4Texte
This activity will help you to explain to your students why a scientist needs you to follow a specific protocol to collect data.
-
Icone
 TitreCreate a determination keyDescriptionFrom CP to TerminaleTexte
This tutorial will show you how to create a simple determination key with the OpenKeys software. You can, for example, create keys referencing only the species present in your region.
-
Icone
 TitreAnalysing dataDescriptionCycle 4 and High SchoolTexte
With Vigie-Nature School, you collect data on biodiversity in your school. This data will be useful to researchers, but you can also use it in class. We suggest several ways to do this.