Some scientific results for Oiseaux des jardins
The Oiseaux des jardins protocol is offered to both schoolchildren and individuals. If we add up the observation data from these two audiences, nearly 19,000 gardens are monitored, generating more than one million observations!
What are the most observed species?
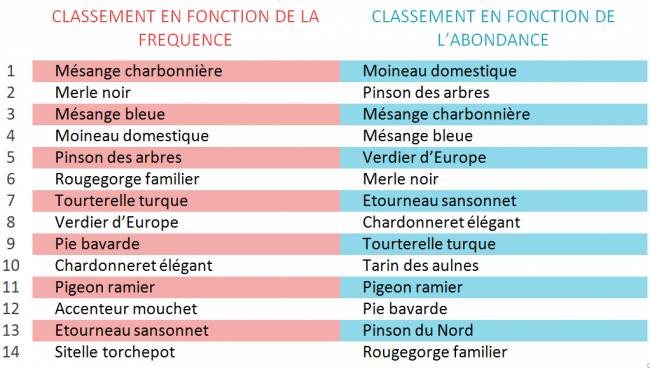
This is the first question considered in the data analysis. Two methods are possible: counting the number of times the different species were seen in the gardens (frequency) or counting the total number of individuals of each species (abundance). These two types of analysis can give different results as shown in this table below.
An average of five to nine species were observed in the gardens. The five most frequent species are, in order, the Chickadee, the Blackbird, the Blue Tit, the House Sparrow and the Tree Finch.
However, the most frequent species are not necessarily the most abundant. For example, the Common Nighthawk (ranked 12th in the table of frequent birds) and the Common Nuthatch (ranked 14th in the table of frequent birds) regularly visit gardens without being numerous since they do not appear in the table of 14 abundant species.
Conversely, the House Sparrow, which is not the most frequent, holds the medal for the number of individuals observed. Similarly, the Alder Tarins and the Northern Finches arrive in groups: more unusual in gardens, their presence does not go unnoticed in view of their numbers, which are greater than those of the Accentors or the Nuthatches!
When to observe birds with your students?
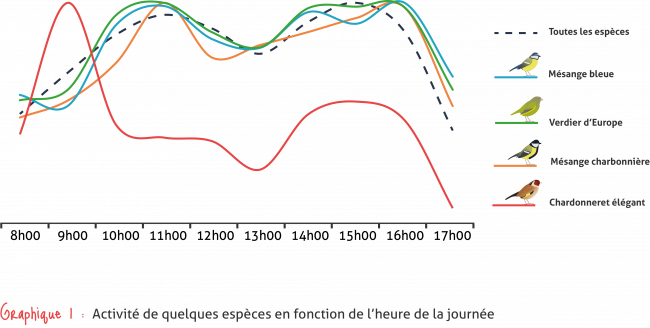
Usually, birders get up very, very early to be able to observe birds... In winter, according to what our BirdLab participants have observed, there is no need to get up at dawn! Observations between 10am and 5pm seem ideal.
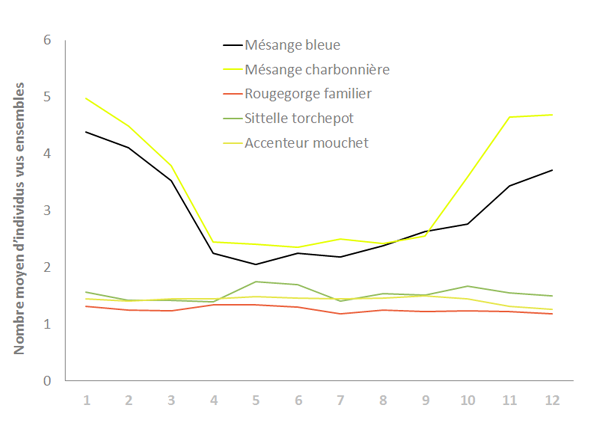
Which species are gregarious ? solitary ?
The most abundant and frequent species in winter, such as the blue tits and the great tits, are those that gather in autumn to look for food. From the summer season, they devote themselves to reproduction and lose this gregarious character to appear only in pairs! The robin, solitary and very territorial, is a familiar sight in gardens all year round, as are the common nuthatch and the shrike.
How does the presence of the species evolve during the year ?
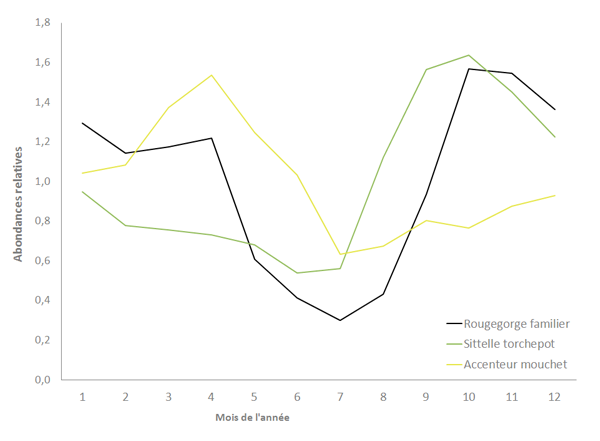
The monthly relative abundance corresponds to the number of individuals of a species divided by the total number of birds, it allows to get rid of the fact that gardens are more or less welcoming for birds. By studying the relative abundances of three species, we notice that they increase during the winter periods. It seems that local populations are reinforced in winter by individuals coming from the North and that several individuals share the same garden. Thus, even if we have the "impression" of always observing the same number of robins, there can be more in winter, they are false sedentaries (see the section "Surviving winter").
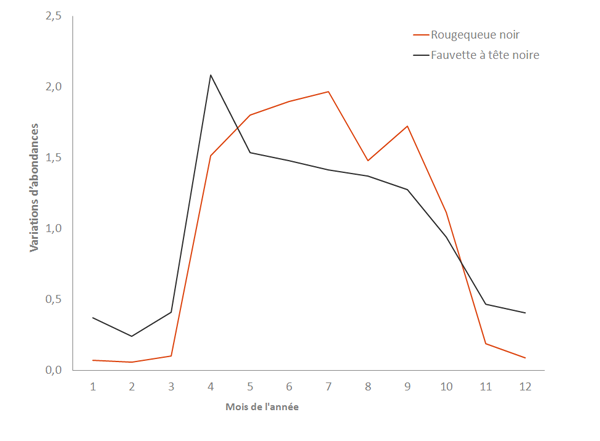
For species such as the Black Redstart and the Black-capped Warbler, which are insectivores and partial migrants in winter, the opposite effect can be observed: it is during the summer season that they are most often observed, whereas they are almost absent from our gardens in winter.
Positionner vos données
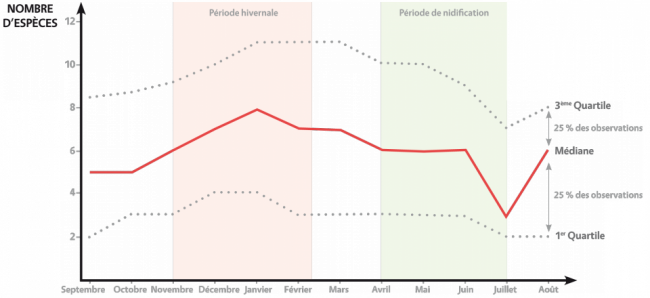
Pensez-vous avoir rencontré un grand nombre d’espèce lors de vos observations ? Pour le savoir, comparez vos résultats aux données nationales, mais attention suivant la saison ce ne sont pas les mêmes espèces d’oiseaux et donc pas la même diversité spécifique qui peut être observée. Replacez vos observations sur le graphique en fonction des mois.
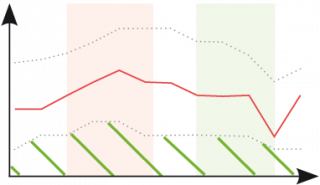
La diversité de votre cour est faible.
Pour accueillir plus d’oiseaux, vous pourriez leur installer des mangeoires en hiver et des nichoirs au printemps. D’autres relevés permettront d’évaluer l’effet de ces mesures.
Votre situation est comparable à celles de la plupart des sites suivis.
Vous pouvez affiner l’analyse en réalisant des relevés en hiver et lors de la nidification pour savoir à quel moment votre cour est la plus attractive.
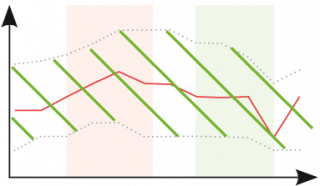
Vous êtes dans une situation exceptionnelle !
Partagez avec d’autres établissements vos astuces pour accueillir une telle diversité !
Nature en STOC
Comment varie la biodiversité confrontée aux pressions croissantes des sociétés ? Ce film expose les méthodes, enjeux et applications du premier observatoire citoyen de la biodiversité en France : le Suivi Temporel des Oiseaux Communs (STOC), organisé par une équipe du Muséum National d'Histoire Naturelle.
