Scientific results of the earthworm plots
The following results were obtained from the data collected through the Worm Plots programme.
The earthworm plot protocol has been offered to farmers since 2011, as part of a partnership between the Observatoire Agricole de la Biodiversité (OAB) and the Observatoire Participatif des Vers de Terre (OPVT). This observatory has been set up many times to better understand the impact of agricultural practices on this soil macrofauna.
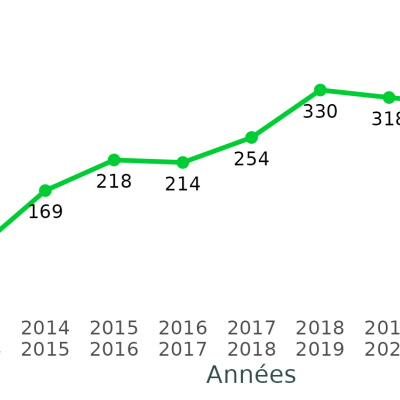
Offered since 2014 on the Vigie-Nature École website, this observatory has been set up nearly 150 times. Although encouraging, this figure is not yet sufficient to draw scientific conclusions on earthworm populations in the green spaces of French schools. However, we can observe the first trends that emerge.
The first thing we can easily look at is the average number of worms observed in each square metre. This number can also be put into perspective with those obtained by farmers.

The average number of earthworms observed in establishment lawns is relatively low, especially when compared to grassland (12.6 earthworms/m² on average in establishment lawns compared to 39 worms/m² on average in grassland). This abundance in grasslands can be explained by a decrease in disturbances (ploughing, phytosanitary products, trampling, etc.) and an increase in available food.
The large amount of data from the agricultural world allows us to observe the differences in earthworm populations depending on the use of the soil.
Results specific to the agricultural sector
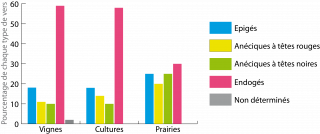
Depending on the type of land use, the composition of the earthworm fauna changes:
- endogeous species are the most frequent (nearly 60% of the worms found) in vineyards and crops,
- In grasslands, the composition is more balanced between the 4 groups of worms.
In addition to differences in faunal composition, the number of worms varies greatly depending on the type of land use. Worms are much more numerous in grasslands, which can be explained by a reduction in disturbance (ploughing, chemical products such as plant protection products) and an increase in the food available.
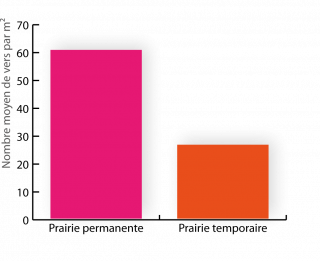
If we look at the grasslands in more detail, we see that in permanent grasslands (not mown for at least one year), worms are more than twice as numerous as in temporary grasslands. This result seems to confirm our last hypothesis: in permanent grasslands the quantity of food available is greater than in temporary grasslands where organic matter is exported during regular mowing.
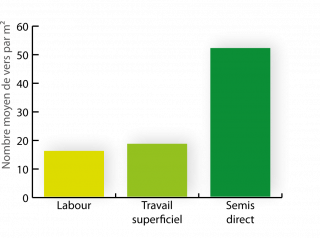
Tillage, whether ploughing or shallow tillage, has a negative effect on the earthworm fauna: earthworm abundance is almost three times lower in a tilled field than in a no-till field.
Results from Vigie-Nature School data
We separated the schools into three groups: those in urban areas, those in rural areas and those in an intermediate context, the peri-urban area. The result is as follows:
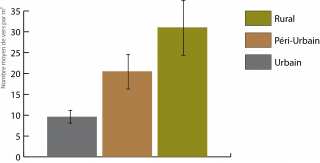
It can be seen here that in urban areas the number of worms per square metre (9.6 worms/m² on average) is three times lower than in rural areas (31.1 worms/m² on average). As we have already seen, the results should be treated with caution due to the limited number of plots studied, but the standard error bars do seem to show a difference in the settlement of urban and rural areas.
These differences could be explained by the fact that in cities the soil has often been reworked during construction, and settlement is also often significant. Certain lawn management methods (use of pesticides for example) and trampling are also hostile to the maintenance of earthworms.
One can imagine that schoolyards in cities are smaller and therefore proportionally more trampled than in rural areas. As we have just seen, intense trampling is harmful to earthworms.
To verify this, we looked at whether the surface area of the schoolyard has an impact on the number of earthworms (we assumed that the larger the schoolyard the less intense the trampling):
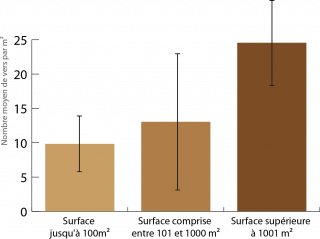
The error bars show that the result is not fully significant (probably due to the fact that there is not enough data yet). However, the trend seems to indicate that a large green space, with less trampling, would favour the presence of more earthworms (an average of 9.8 worms/m² is found for an area of less than 100 m² compared to 24.5 worms/m² for an area of more than 1001 m²).
Positioning your data
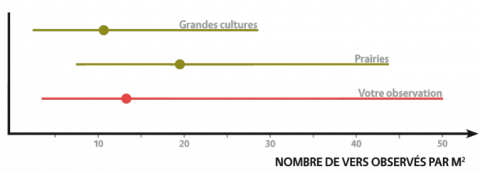
Compare the number of earthworms you have observed with the data known from two other types of environment, grasslands and crops. The assumption is that the results of your observations in the urban environment will be close to those in the grassland environment. Place your observations on the red line to compare them to the red point (the median of the observations made in the agricultural world).
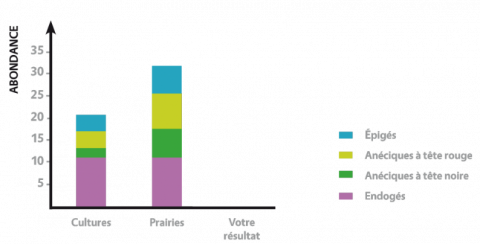
Plot the abundance of worms according to their group on the graph, this distribution also makes it possible to compare the environments between them. Endogeous worms are the most numerous (50% of all worms) and the least sensitive to surface conditions. As a result, the mustard protocol is less effective on this group and does not allow us to count all of them.
Understanding your result :
If you have observed few epigids and anecids, this may be due to high temperatures, severe drought, trampling that damages the galleries of the anecids or to a low amount of food (e.g. if all the grass is collected during mowing). High predation, including bird predation, can also exacerbate this result. One way to improve the situation is to arrange rest periods for the lawns and to avoid exporting organic material when mowing. Remember that worms are essential for the proper functioning of the soil. In addition, anecdotes will store carbon in the soil by burying plants, thus contributing to the fight against global warming!