Vigie-Bat
Metropolitan France has 36 species of bats. Some of them are found throughout the territory, such as the common pipistrelle or the common serotine, while others have a limited distribution, such as the long-fingered bat, which is only present in the Mediterranean region. We know little about the distribution of many species in most regions. This is mainly due to their discretion, to how difficult it is to study them, and to our ever-changing knowledge of them. Thus the Alcathoe bat was only discovered in the early 2000s!
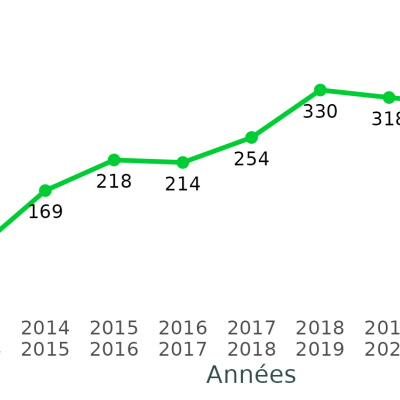
Several long-running studies of rare species suggest that most species are in decline. Vigie-Bat tracks common bats as they hunt and makes it possible to assess the population’s state of health.. This guide will explain how you and your pupils can participate. We’re counting on you!
Have a look on the presentation video:
The protocol:
- Set up your ultrasound bat detector, following the instructions in the enclosed configuration guide.
- Place the detector close to your establishment. You’ll want to start recording 30 minutes before sunset, so be sure to set up your device early enough. Stop recording 30 minutes after sunrise. After each night of recording, collect your device and transfer the data to a hard disk (CAREFUL! several gigabytes will be recorded over the course of the night and your memory card may soon be full). You will then have to divide and rename the files according to our data transfer guide. As the volume of these files is very large, even for a single night of recording, sending them may take several hours.
- Following the first night of recording. If your institution is large enough, you can move the device another night by at least 150 m (please note that you will need to define two recording spots when sending the recordings). You can, for example, vary the location of the recorder between one lit and one dark area to better understand the impact of artificial light on the hunting habits of bats.
- And after that? Once the recordings have been made, you will need to
- deposit them on the Vigie-Bats platform. The website allows you to analyze your recordings and identify the bats that frequent your premises. The analysis generally takes less than 48 hours. At the same time, we will send you a summary table of all the sounds detected during the night, a graphical illustration of this table, and some recordings so that your pupils can try to identify them from the species sheets. Also, don’t forget to return the device to us!
Let’s begin by having a look on these documents:
- The participant's booklet which provides all the tools you will need to be part of this journey, such as the (printable!) identification key,
- The observatory's poster.
When to participate?
This protocol can be carried out from the start of the school year through 1 November, and from 1 April until the summer holidays.
We can lend you an ultrasonic bat detector free of charge. Contact us as soon as possible to reserve it.
A few precisions
How long can I keep the ultrasound detector?
We generally lend our bat detector for a maximum of one week in order to make it available to as many classes as possible.
Pay close attention to the weather conditions.
If the wind blows above 15 km/h, the bats’ activity is likely to be limited to the most sheltered areas. Note that if 30 minutes after sunset, the temperature drops below 10°C, bat activity is limited and it is unlikely that you will record many calls.
Remember to define your observation area well in advance!
Have a look here to get more familiar with all the information you will need to collect once you are in the field.
Sending your observations
Once your recordings have been done, you will be able to submit them on our platform (Vigie-Chiro). This platform is dedicated to the analysis and determination of the different species recorded. Please note that the analysis usually takes less than 48 hours. At the same time, we will send you a summary table of all the sounds detected during the night, a graphical representation of this table and some recordings so that your pupils can try to identify them from the determination cards we provide. Please also remember to return the device to us!
You may find that questions and hypotheses concerning the distribution of living beings arise from your observations (are there as many birds in the city as there are in the countryside? Does the use of pesticides have consequences on snails, etc.). The data positioning tools included in the participation report, which is sent at the end of the school year to all who are registered on the website, provides answers to some of these questions. The graphics included in the report position the observations made in a given establishment in relation to the data collected as a whole. For example, you will learn whether observing 4 species of snails in an establishment is a sign of healthy or poor biodiversity. Explanations are provided to help you interpret the results. These documents encourage your pupils to consider which actions could be taken to promote biodiversity in the courtyard or playground (installation of feeders, setting aside plots of land, etc.).By repeating the observations, you will be able to monitor the impact of these actions over time.
You can also process the data you’ve collected in other ways. For example, you can create graphics representing the species present in different areas of the establishment. These graphics allow pupils to visualize in a simple manner that there is a significant difference between two areas of the schoolyard. They can then propose hypotheses to explain the population differences (abiotic factors such as humidity, temperature for example).
You can also produce graphs showing the evolution of the number of species present seasonally. They allow you to follow changes in the number of individuals over the course of the year (for example, for the notion of bird migration). It is also possible to produce such graphs over several years by accumulating the numbers recorded month by month.
Many other illustrations are possible. For example, pupils can be asked to situate their data on an aerial photo of the school. They can then offer explanations for possible differences in the occupation of the various areas of the school.
Finally, you will find a wide range of educational activities on our website. Some of them are suggestions for introducing this activity but others take it a step further. For example, we have developed ways for your pupils to learn how to analyze data in the manner of an ecological researcher, or for them to think about actions to be taken within their establishments to promote biodiversity.
Protocole chiro : Vigie-chiro
Pedagogical tipsHere are some suggestions for activities that can help you integrate this observatory to your educational progress.
-
Icone
 TitreCreating a weather station in ArduinoDescriptionCycle 4 - High ShcoolTexte
In this activity, we suggest that you and your technology colleague enable your pupils to make sensors that allow them to measure the environment (temperature, humidity, etc.).
-
Icone
 TitrePromoting biodiversity in your institutionDescriptionCycles 2, 3 and 4 - High SchoolTexte
Thanks to different action proposals, we will see how to promote biodiversity within your school. The Vigie-Nature School protocols will allow us to monitor the impact of these actions on biodiversity.
-
Icone
 TitreHypothesisDescriptionCycles 2, 3 and 4 - High SchoolTexte
In this game the pupils have to design a data collection protocol. The protocol chosen for the duration of the game will influence the amount of data collected, its quality and therefore the scientific results!
-
Icone
 TitreCreate a determination keyDescriptionFrom CP to TerminaleTexte
This tutorial will show you how to create a simple determination key with the OpenKeys software. You can, for example, create keys referencing only the species present in your region.